In a wastewater laboratory, we’re typically focused on effluent quality. Influent is usually only analyzed for a handful of basic analytes (BOD, TSS, pH, some metals) to calculate loading rates and provide a general understanding of how that influent could possibly impact treatment. However, the COVID pandemic has greatly changed that. The only other time I’ve been so focused on influent was during the 2013 Flood, when we were trying to figure out what was in the water that was coming into the plant.
Many facilities have been analyzing influent for SARS-CoV-2 for almost 3 years now and we’ve learned so much during that time. At the Boulder WRRF, we first started analyzing for COVID in our wastewater in March 2019. We began with Biobot and, after a handful of samples, had a strong correlation with the case data that Boulder County Public Health (BCPH) was posting on their website. During the spring of 2019, we also participated in COVID wastewater studies with GT Molecular and the USGS and were able to compare data from different labs. Additionally, we began monitoring sub-sewershed areas to get some baseline data and evaluate the usefulness of grab samples. In the summer of 2019, we officially joined the COllaborative, a group of local utilities, CDPHE, and CSU that were aimed to put our heads and efforts together while we were all trying to figure out the best plan of action during the madness of the pandemic.
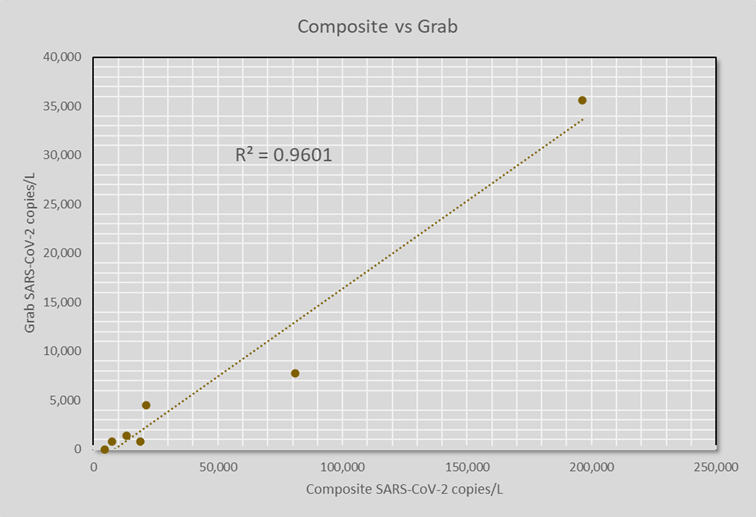
While composite samples will always remain the gold standard in representative wastewater sampling, it’s not always feasible to have enough autosamplers to achieve this. We did a study in 2019 in our most residential neighborhood to evaluate grab samples for SARS-CoV-2. With only 7 samples, we had a fairly strong correlation (R2 = 0.96) between grab and composite samples. We learned that collecting the grab samples at “peak fecal flow” time results in the best correlation, which requires having some knowledge of the sewershed.
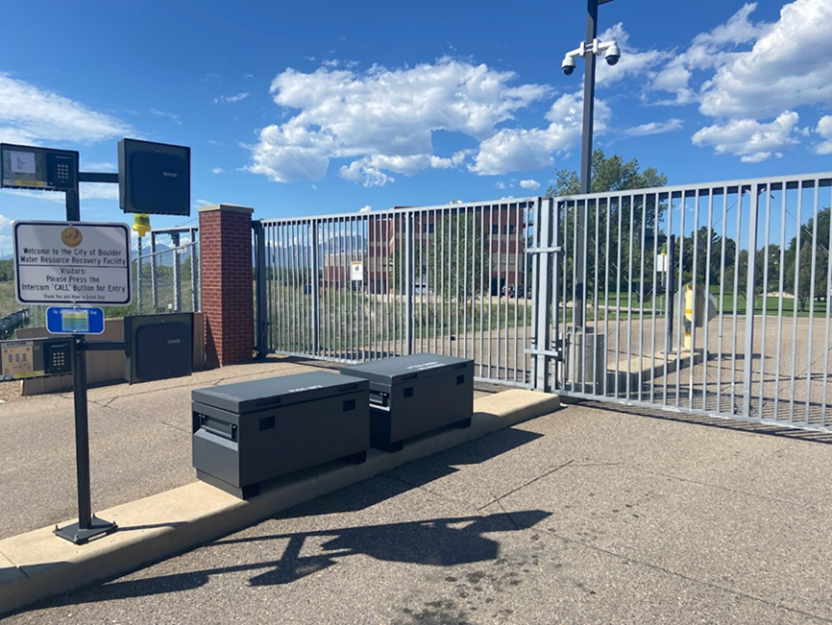
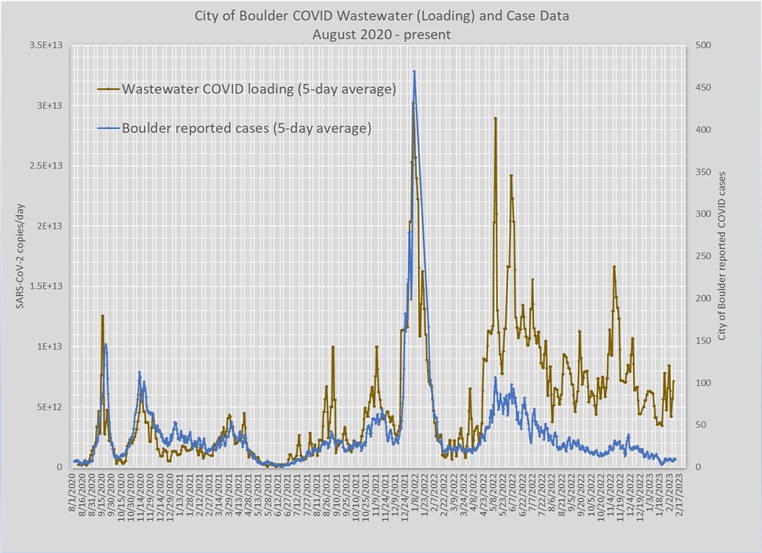
We also learned several things about analyzing the data. In the lab, we tend to focus on concentration (copies/L) data. However, we’ve found that it’s more useful to look at COVID loading (copies/day) data to get a good picture of community infection. When we began receiving sewershed level case data from BCPH, we noticed case data was evaluated with a 5-day rolling average, so we started running a 5-day rolling average on our wastewater data, as well. Wastewater data can also be prone to spikes due to the challenging matrix. This means it is not useful to analyze single data points but more important to look at trends over time. We also learned that sample pickup could be a bigger headache than it should be. When the COllaborative began providing a shared, dedicated courier for multiple facilities, our sample delivery woes subsided. Also, we installed a pickup (and drop-off) tote that is just outside our gate, which allows couriers to grab samples without gaining facility access and has proven useful for the entire facility.
In my opinion, the most important thing that we have learned is that wastewater-based epidemiology can be successful, has incredible potential, and should be explored and utilized. While our COVID case data has correlated well with wastewater data for about 2 years, in the spring of 2022 we began to see a divergence between COVID wastewater data and case data. Most of us believe this is because, after 2 years of the pandemic, most people have grown weary of testing and reporting and simply don’t care anymore. However, we’re all still pooping. So, we’ve learned that case data is influenced by social factors- people have to go get tested or test at home and then report the positive results. Therefore, wastewater data may be a better indication of community infection than data reported by public health organizations.

We continue to analyze our influent for COVID twice per week and this data all funnels into the CDC National Wastewater Surveillance System (NWSS) (https://www.cdc.gov/nwss/wastewater-surveillance/index.html). The CDC has also setup two Centers of Excellence, one here in Colorado (https://www.du.edu/nwsscoe) and the other in Houston, to continue advancing this field and science. The Water Environment Federation (WEF) is also involved with things like the NWSS Utilities Community of Practice (https://nwbe.org/?page_id=169), programs to provide autosamplers (https://nwbe.org/wp-content/uploads/2023/02/WEF-autosampler-flow-meter-invitation-2-6-23.pdf), workshops, etc. We are also beginning to look at wastewater surveillance from a global perspective and learn from other countries, as well as considering equity in monitoring. Additionally, there are still many ethical and privacy considerations to be thoroughly considered.
However, the power of poop has been revealed and we want to be more prepared for the next large-scale pandemic or infection. The NWSS plans to add several components to its core surveillance panel in 2023 to include things like influenza, RSV, norovirus, and antibiotic resistance genes. Progress continues to be made in finding the best ways to display this data through public dashboards. And, of course, funding is key and will play a critical role in the future of this data. But it has become clear that we have more to learn from those influent samples than just calculating BOD loading. What gets flushed down the toilet and shows up at our headworks has the potential to tell us so much about a community and we’re just beginning to tap into the power of that information.
Melissa Mimna is Laboratory Program Supervisor for the City of Boulder where she’s worked in the WRRF laboratory for the past 10 years. Melissa is also currently serving on the CO NWSS Center of Excellence Advisory Committee so please reach out with any wastewater-based surveillance questions or ideas (or if you have poop jokes or puns to share).
 Welcome to the
RMWQAA Website!
  Welcome to the
RMWQAA Website!